on
Improve your workflow by managing your machine learning experiments using Sacred
Model tuning is my least favorite task as a Data Scientist. I hate it. I think it’s because managing the experiments is something that always gets very messy. While searching for tools to help me with that I saw a lot of people mentioning Sacred, so I decided to give it a try.
In this article, we’ll see how to use Sacred and Omniboard to manage our experiments. Spoiler alert: the tool is awesome and building experiments it actually kind of fun now.
How Sacred works?
We use Sacred decorators in our model training script. That’s it! The tool automatically stores information about the experiment for each run. Today we’ll store the information using MongoDB and visualize it using the Omniboard tool. Ok, let’s get started.
Using SACRED
Here’s a step by step guide:
-
Create an Experiment
-
Define the main function of the experiment
-
Add the Configuration parameters
-
Add other metrics
-
Run the experiment
1 — Create an Experiment
First we need to create an experiment. It’s very simple:
    from sacred import Experiment

    ex = Experiment("our_experiment")
Done!
2 — Define the main function of the experiment
The run method runs the main function of the experiment. The @ex.automain decorator defines and runs the main function of the experiment when we run the Python script. It is equivalent to:
    from sacred import Experiment

    ex = Experiment("our_experiment")

    @ex.main
    def run():
        pass

    if __name__ == '__main__':
        ex.run_commandline()
Let’s use @ex.automain instead:
    from sacred import Experiment

    ex = Experiment("our_experiment")

    @ex.automain
    def run():
        pass
3 — Add the Configuration parameters
The Configuration parameters are also stored in the database for every run. There are a lot of ways of setting them: through Config Scopes, Dictionaries, and Config Files. Let’s stick with the Config Scope here.
We’ll use this Online Retail Dataset and use scikit-learn’s Time Series cross-validator to split the data. The model will predict if an order will be canceled or not. Let’s define the criterion parameter:
    from sklearn.tree import DecisionTreeClassifier
    from sklearn.model_selection import TimeSeriesSplit
    import pandas as pd
    from sacred import Experiment

    ex = Experiment('online_retail_tree')

    @ex.config
    def cfg():
        criterion = "entropy"

    @ex.automain
    def run(criterion):
        dateparse = lambda x: pd.datetime.strptime(x, '%d/%m/%Y %H:%M')

        df = pd.read_csv("Online Retail.csv", parse_dates["InvoiceDate"], date_parser=dateparse, decimal=",")

        df = df.sort_values(by="InvoiceDate")

        df["canceled"] = df["InvoiceNo"].apply(lambda x: x[0] == "C")

        X = df.loc[:,["Quantity","UnitPrice"]]
        y = df.loc[:, ["canceled"]]

        ts_split = TimeSeriesSplit(n_splits=10)

        clf = DecisionTreeClassifier(criterion=criterion)

        for train_index, test_index in ts_split.split(X):
            X_train = X.iloc[train_index]
            y_train = y.iloc[train_index]

            X_test = X.iloc[test_index]
            y_test = y.iloc[test_index]

            clf.fit(X_train, y_train.values.ravel())
            y_pred = clf.predict(X_test)
4 — Adding other metrics
Sacred collects information about the experiments but we usually also want to measure other things. In our case here I want to know the number of canceled orders in each split. We can use the Metrics API for that.
Sacred supports tracking of numerical series (e.g. int, float) using the Metrics API. The _run.log_scalar(metric_name, value, step) method takes a metric name (e.g. “training.loss”), the measured value and the iteration step in which the value was taken. If no step is specified, a counter that increments by one automatically is set up for each metric. — Metrics API
    from sklearn.tree import DecisionTreeClassifier
    from sklearn.model_selection import TimeSeriesSplit
    import pandas as pd
    from sacred import Experiment

    ex = Experiment('online_retail_tree')

    @ex.config
    def cfg():
        criterion = "entropy"

    @ex.automain
    def run(criterion):
        dateparse = lambda x: pd.datetime.strptime(x, '%d/%m/%Y %H:%M')

        df = pd.read_csv("Online Retail.csv", parse_dates["InvoiceDate"], date_parser=dateparse, decimal=",")

        df = df.sort_values(by="InvoiceDate")

        df["canceled"] = df["InvoiceNo"].apply(lambda x: x[0] == "C")

        X = df.loc[:,["Quantity","UnitPrice"]]
        y = df.loc[:, ["canceled"]]

        ts_split = TimeSeriesSplit(n_splits=10)

        clf = DecisionTreeClassifier(criterion=criterion)

        for train_index, test_index in ts_split.split(X):
            X_train = X.iloc[train_index]
            y_train = y.iloc[train_index]

            X_test = X.iloc[test_index]
            y_test = y.iloc[test_index]

            clf.fit(X_train, y_train.values.ravel())
            y_pred = clf.predict(X_test)

            true_cancel_count = y_test["canceled"].value_counts().tolist()[1]

           pred_cancel_count = y_pred.tolist().count(True)

           train_cancel_count = y_train["canceled"].value_counts().tolist()[1]

           ex.log_scalar("true_cancel_count", true_cancel_count)
           ex.log_scalar("pred_cancel_count", pred_cancel_count)
           ex.log_scalar("train_cancel_orders", train_cancel_count)
5 — Running the experiment
We’ll use MongoDB Observer to store the information about the experiment:
Sacred helps you by providing an Observer Interface for your experiments. By attaching an Observer you can gather all the information about the run even while it is still running. — Observing an Experiment
To save the data to a mongo database called my_database we simply run python3 my_experiment.py -m my_database.
Now there is data about the experiment but now we need to visualize it. We will use Omniboard for that.
Using OMNIBOARD
Omniboard is a dashboard for Sacred written with React, Node.js, Express and Bootstrap.
To install it run npm install -g omniboard and to start we run omniboard -m hostname:port:database, in our case: omniboard -m localhost:27017:my_database.

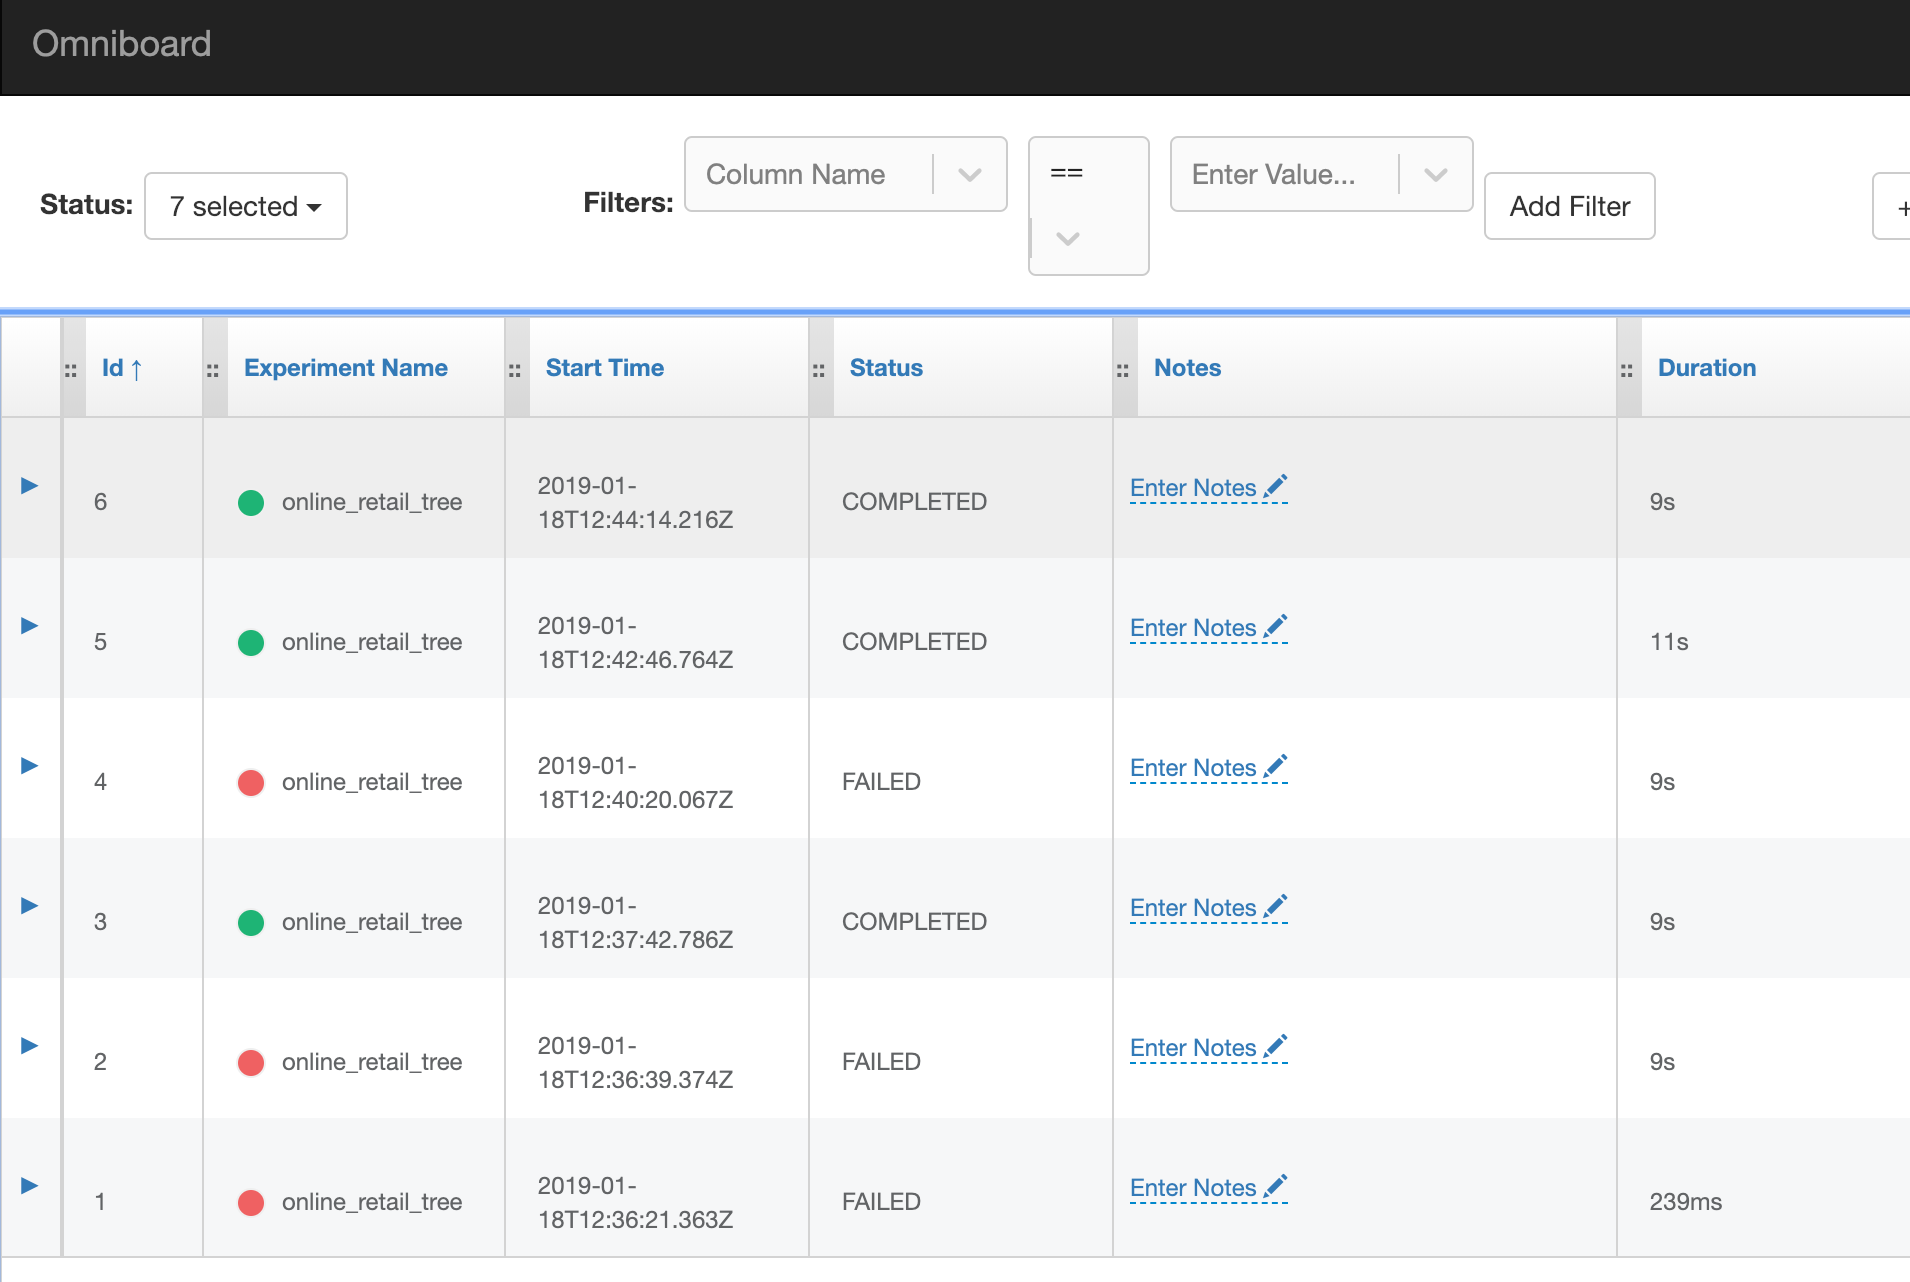
We can see if an experiment failed or not, the duration of the experiment, add notes and so on.

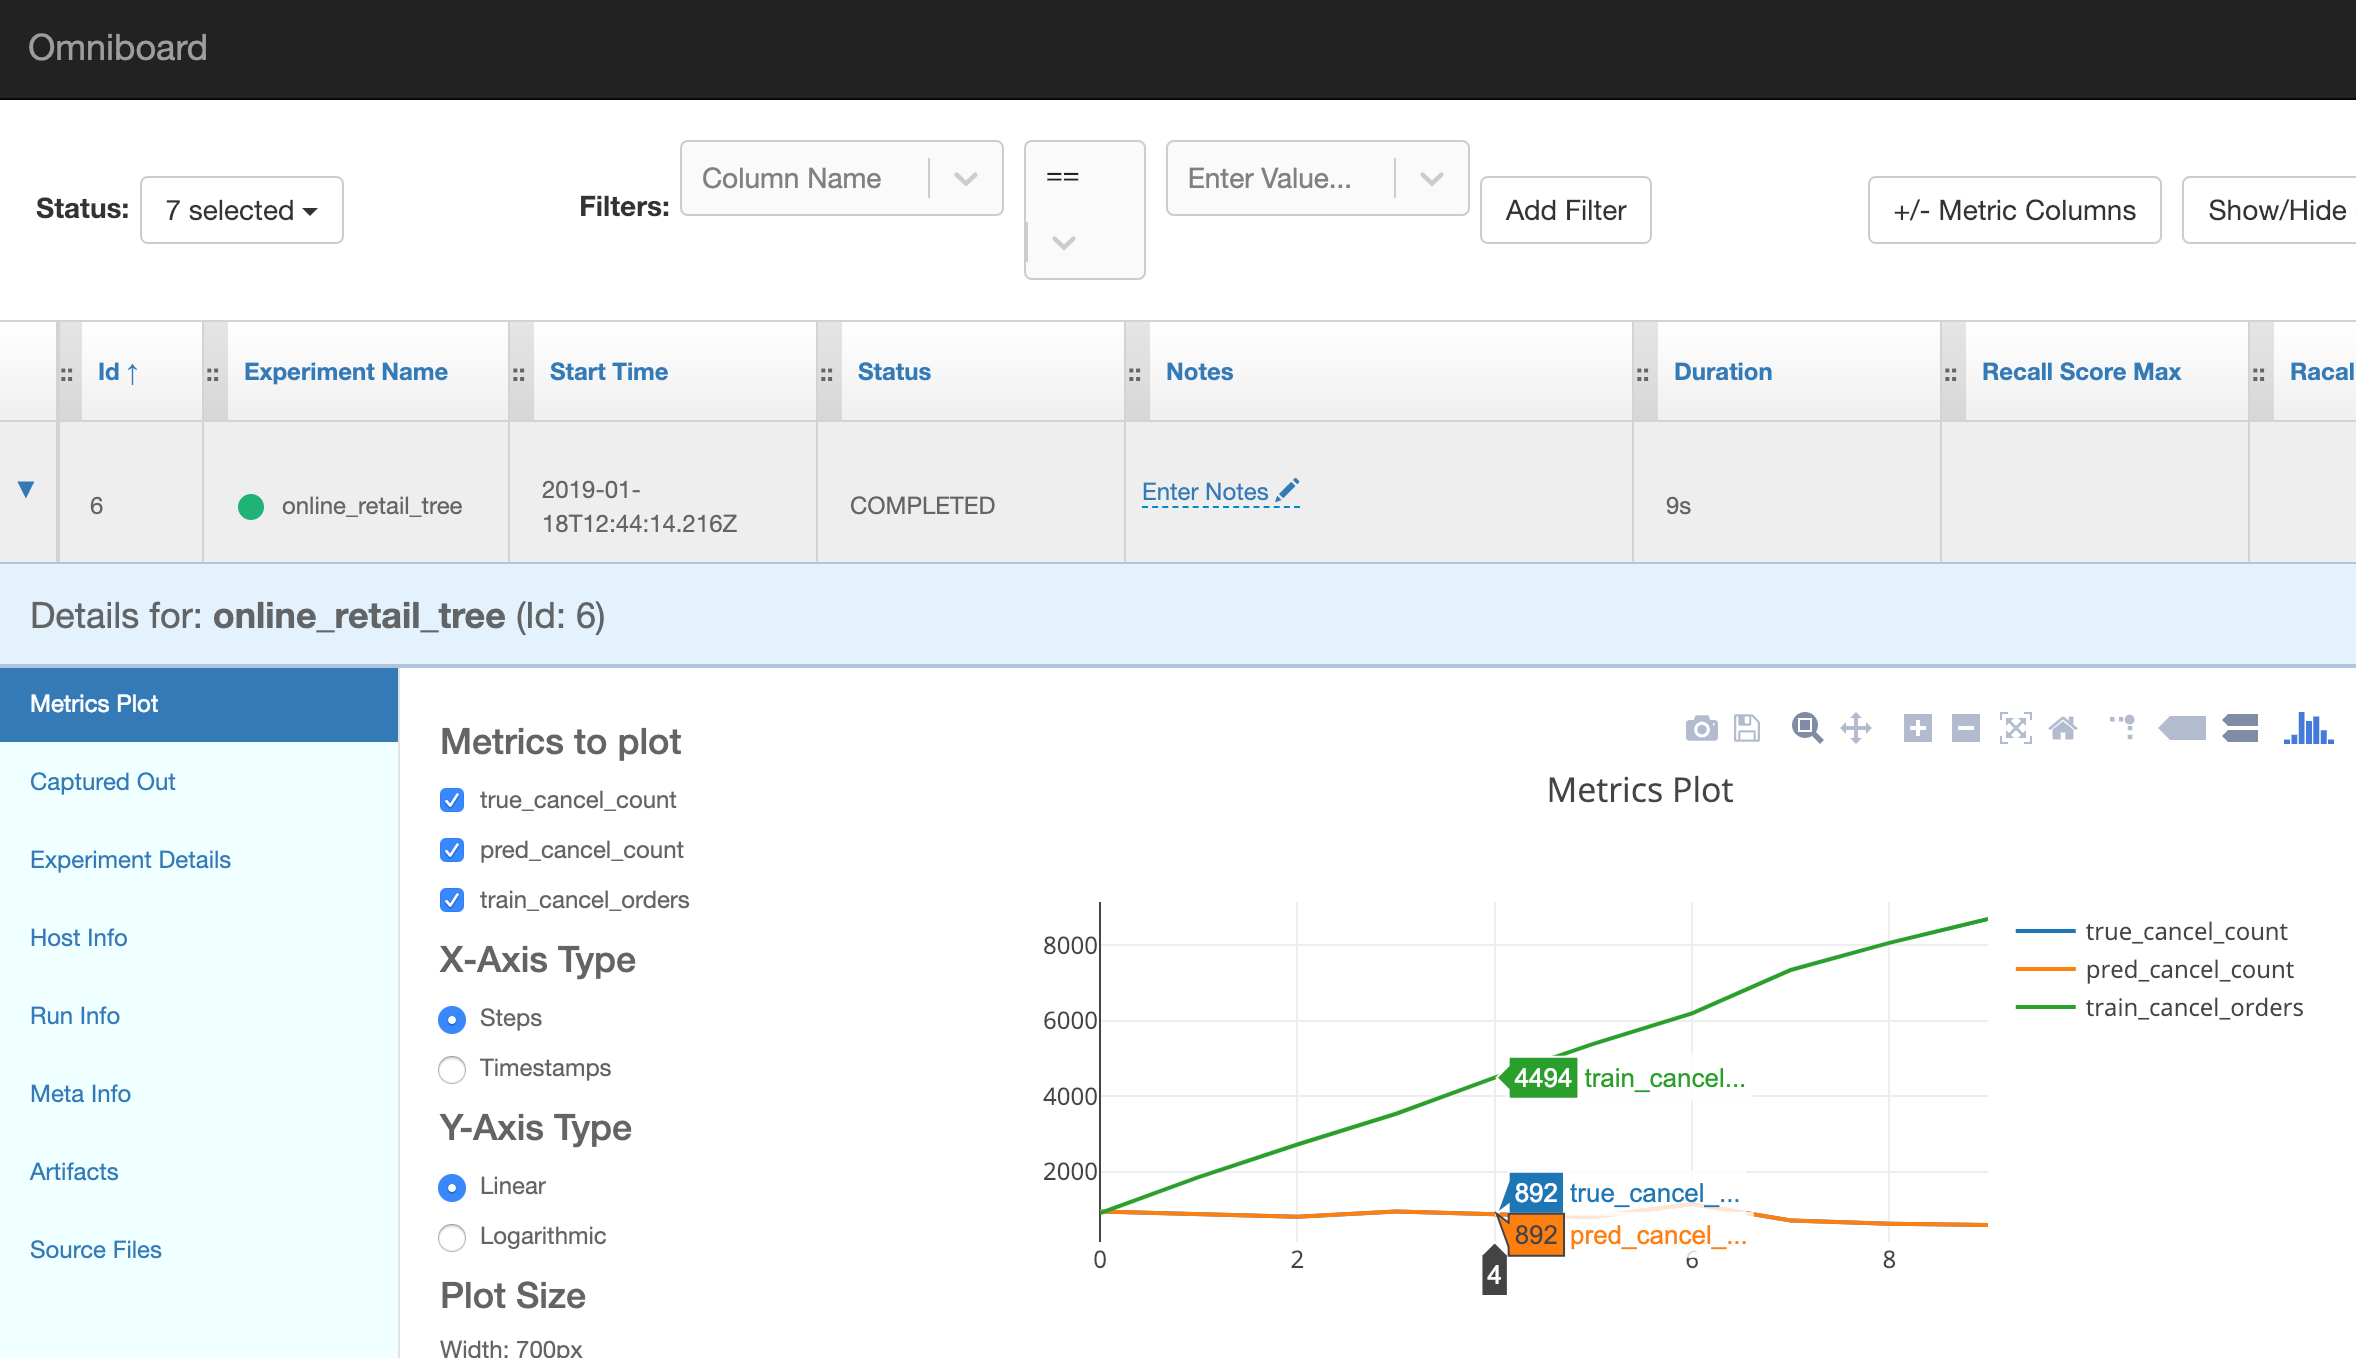
The detail view shows a graph with the metrics we tracked and we can also view the command line output, the source code (awesome) and other experiment details.
So what?
Sacred is a great tool because now we don’t have to worry about saving the results of our experiments. Everything is stored automatically and we can go back and analyze *any *experiment.
The tool was designed to introduce only minimal overhead, and in my opinion that’s what makes it great.
The main message here is: give Sacred a try! I can say that my workflow is much better now because of it. 🙂
Do you use another tool for the same purpose? I would like to hear about other alternatives as well. And thanks for reading!
This article first appeared on Towards Data Science
 for the pick)](https://cdn-images-1.medium.com/max/2000/0*RAONZCLWlhVb98iG)